
Oracle Critical Patch Update Oktober 2020 – Statistiken und Grafiken
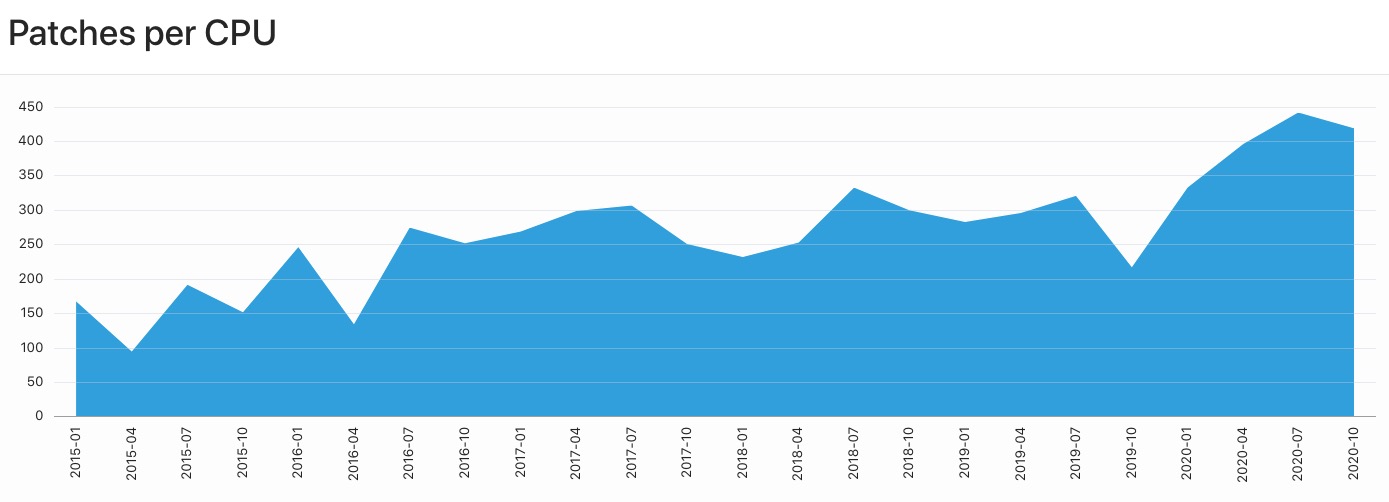
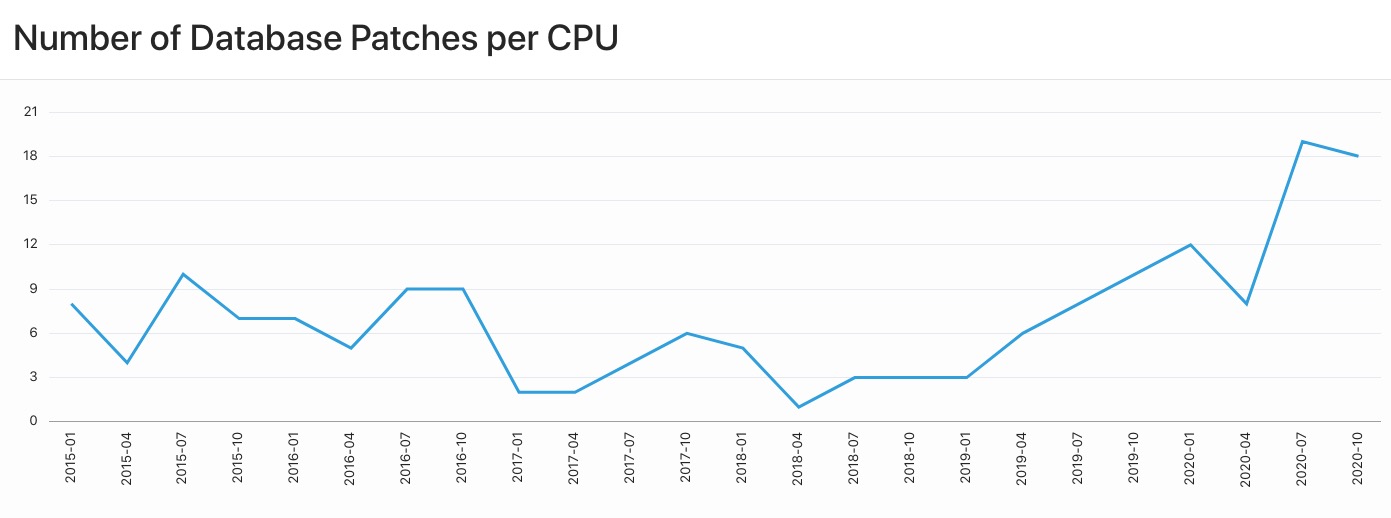
Mit insgesamt 420 Patches bleibt die Anzahl der Korrekturen, die Oracle mit dem Oktober-Quartalspatch für eine Produktpalette ausliefert, auf hohem Niveau (Vorquartal: 443). Auch bei den Datenbank-Patches bleiben die Zahlen auf hohem Niveau: mit 18 Patches ist es nur eine Korrektur weniger als im Vorquartal.
Gesamtzahl an Patches pro CPU (alle Produkte)
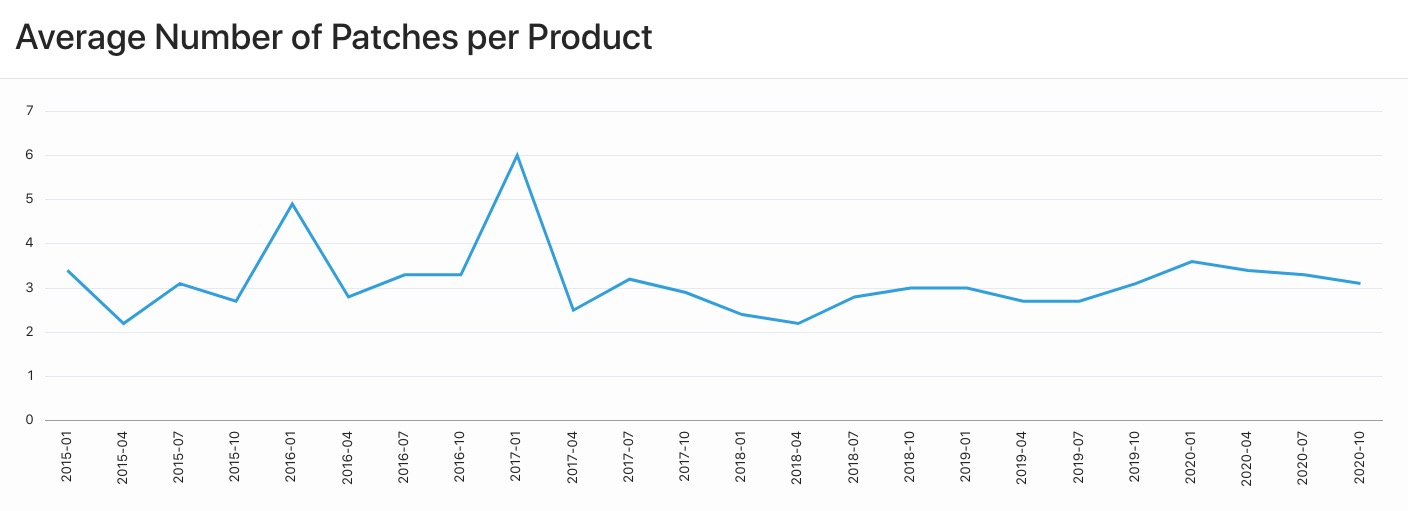
Durchschnittliche Anzahl von Patches pro Produkt
Anzahl Datenbank-Patches pro CPU
Anzahl Datenbank-Patches vs. Mittelwert (Patches pro Produkt)
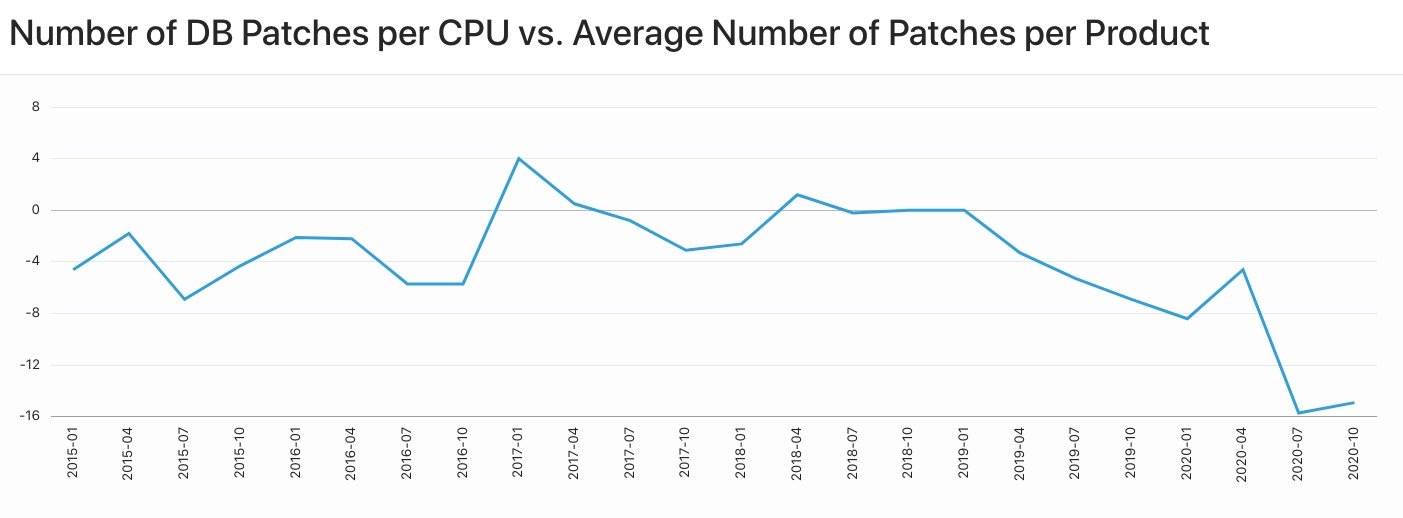
In diesem Quartal war der Mittelwert (3.1 Patches pro Produkt) um 14,9 geringer als die Anzahl der DB-Patches (18).
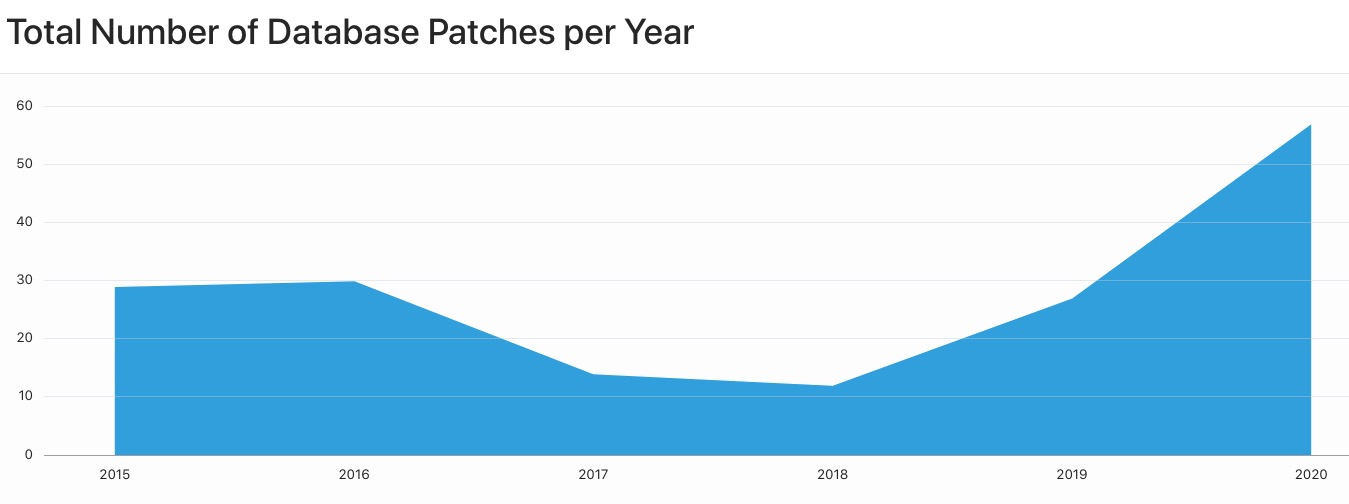
Gesamtzahl der Datenbank-Patches pro Jahr
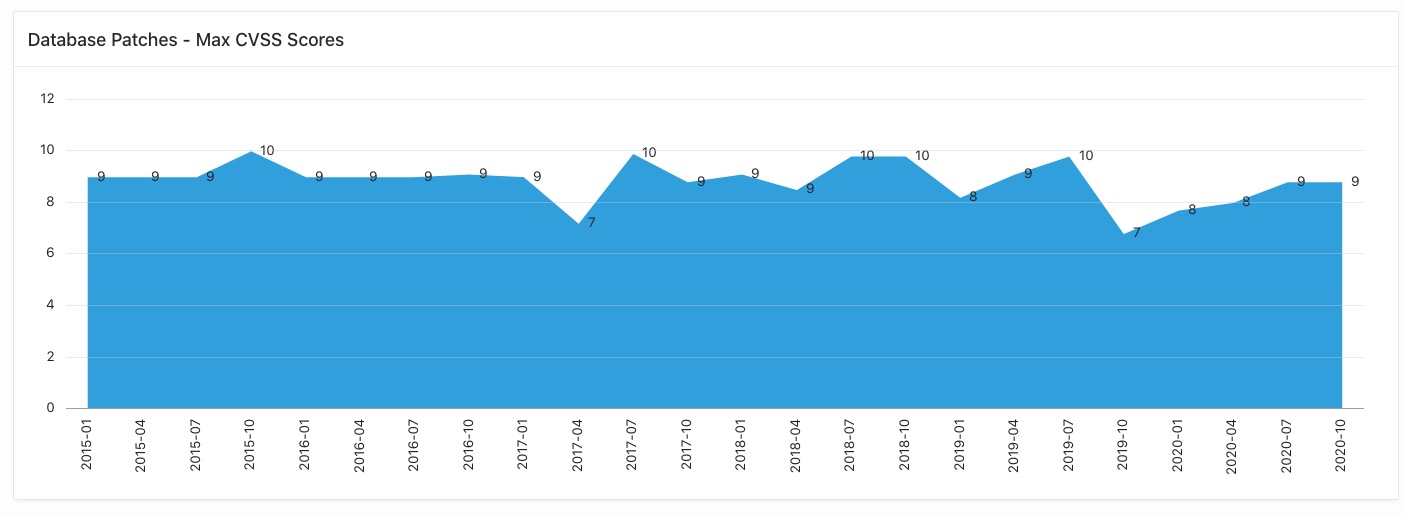
Maximale CVSS-Scores der Datenbank-Patches
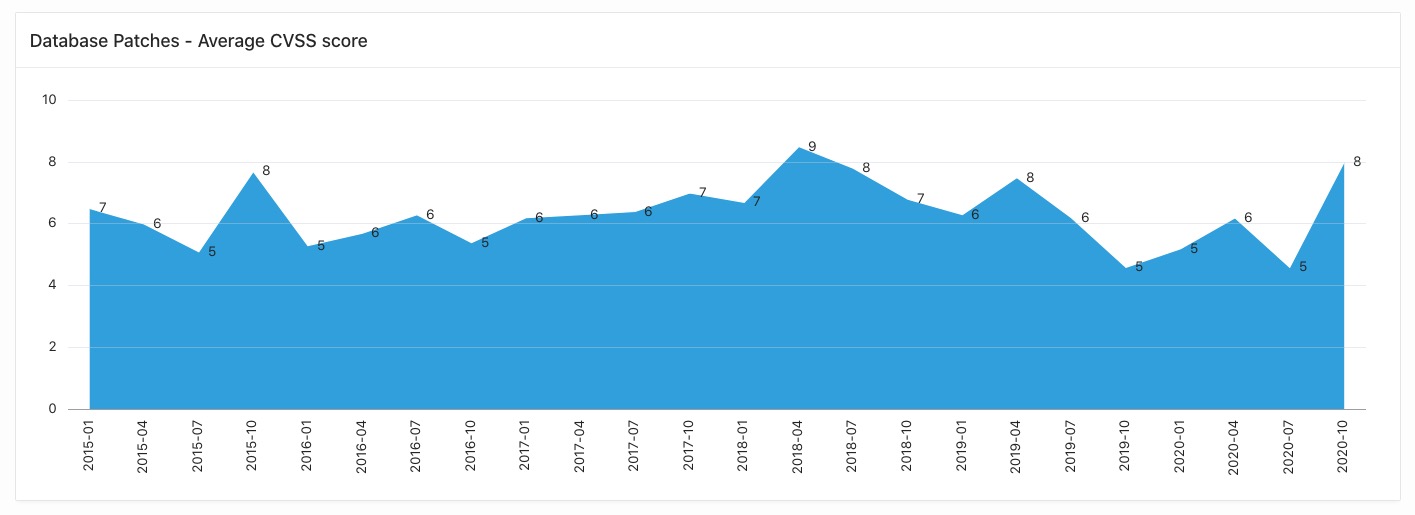
Mittelwert der CVSS-Scores der Datenbank-Patches
Gesamtübersicht
| QuarterDescending | #Patches | #affected Products | %Difference to previous Quarter | Average Number of Patches per Product | #Database Patches | Average CVSS Score (DB Patches) | Maximum CVSS Score (DB Patches) |
|---|---|---|---|---|---|---|---|
| 2020-10 | 420 | 137 | -5 | 3.1 | 18 | 8 | 8.8 |
| 2020-07 | 443 | 136 | 12 | 3.3 | 19 | 4.6 | 8.8 |
| 2020-04 | 397 | 116 | 19 | 3.4 | 8 | 6.2 | 8 |
| 2020-01 | 334 | 93 | 53 | 3.6 | 12 | 5.2 | 7.7 |
| 2019-10 | 219 | 72 | -32 | 3.1 | 10 | 4.6 | 6.8 |
| 2019-07 | 322 | 121 | 8 | 2.7 | 8 | 6.2 | 9.8 |
| 2019-04 | 297 | 110 | 5 | 2.7 | 6 | 7.5 | 9.1 |
| 2019-01 | 284 | 94 | -6 | 3 | 3 | 6.3 | 8.2 |
| 2018-10 | 301 | 101 | -10 | 3 | 3 | 6.8 | 9.8 |
| 2018-07 | 334 | 121 | 31 | 2.8 | 3 | 7.8 | 9.8 |
| 2018-04 | 254 | 115 | 9 | 2.2 | 1 | 8.5 | 8.5 |
| 2018-01 | 233 | 97 | -8 | 2.4 | 5 | 6.7 | 9.1 |
| 2017-10 | 252 | 88 | -18 | 2.9 | 6 | 7 | 8.8 |
| 2017-07 | 308 | 97 | 3 | 3.2 | 4 | 6.4 | 9.9 |
| 2017-04 | 300 | 121 | 11 | 2.5 | 2 | 6.3 | 7.2 |
| 2017-01 | 270 | 45 | 7 | 6 | 2 | 6.2 | 9 |
| 2016-10 | 253 | 76 | -8 | 3.3 | 9 | 5.4 | 9.1 |
| 2016-07 | 276 | 84 | 103 | 3.3 | 9 | 6.3 | 9 |
| 2016-04 | 136 | 49 | -45 | 2.8 | 5 | 5.7 | 9 |
| 2016-01 | 248 | 51 | 62 | 4.9 | 7 | 5.3 | 9 |
| 2015-10 | 153 | 56 | -21 | 2.7 | 7 | 7.7 | 10 |
| 2015-07 | 193 | 63 | 101 | 3.1 | 10 | 5.1 | 9 |
| 2015-04 | 96 | 43 | -43 | 2.2 | 4 | 6 | 9 |
| 2015-01 | 169 | 50 | 10 | 3.4 | 8 | 6.5 | 9 |
… und wie immer gilt: das sind alles nur Statistiken und Grafiken 🙂
Links: